
How to Monitor Web Traffic for Restaurant Equipment Sales
Think of monitoring web traffic as your digital secret shopper. You're using an analytics tool—like Google Analytics 4 or a similar platform—to track, measure, and understand everything happening on your website. This isn't just about counting clicks; it's about seeing who is visiting, how they got there, and what they do once they arrive.
This data is the raw material that, when analyzed correctly, becomes your best source of business intelligence.
Why Web Traffic Is Your Most Valuable Business Insight

In the competitive world of restaurant equipment, your website isn't just a digital catalog—it's your 24/7 sales floor. But just having the doors open online isn't enough. You need to know what's happening inside. You have to be able to tell the difference between a serious buyer researching specific deck ovens and someone just browsing for ideas.
Understanding your traffic data lets you see exactly how customers find you. Was it a Google search for "commercial deep fryers"? A link from a popular food service blog? Or a click-through from your latest email campaign? To really get a handle on this, it helps to understand what is marketing analytics and how it can fuel your growth.
For restaurant equipment sellers, paying attention to web traffic isn't optional—it's the foundation of a smart digital strategy. Here's a quick look at why it's so important.
| Why Monitoring Your Web Traffic Matters | |---|---| | Benefit | What It Means for Your Business | | Understand Your Customers | Pinpoint if your visitors are independent pizzeria owners, hotel chains, or school cafeteria managers. | | Optimize Your Marketing | See which channels (e.g., Google Ads, SEO, email) are actually bringing in qualified leads and sales. | | Improve Your Website | Identify which product pages are most popular and where users might be getting stuck or leaving your site. | | Increase Sales & ROI | Make data-backed decisions to allocate your budget effectively and focus on what truly drives revenue. |
In short, these insights move you from guessing what works to knowing what works.
Turning Data into Actionable Strategy
Monitoring traffic takes the abstract numbers and turns them into a clear roadmap for boosting your sales. It gives you the power to answer the questions that really matter for your business:
- Who are my actual customers? Are they the independent restaurant owners you're targeting, or are you attracting a different audience entirely?
- What content actually interests them? Are they spending time on your commercial refrigerator pages or your blog posts about kitchen ventilation?
- Which marketing efforts are paying off? Is that paid ad campaign on LinkedIn outperforming your email newsletter, or is it the other way around?
- Where are people getting stuck? Do potential buyers consistently abandon their carts when they get to the shipping information page?
This is the kind of insight that lets you stop wasting money and start investing it. You can refine your product listings, create content that speaks directly to your customers' problems, and pour your marketing budget into the channels that deliver real results. For a deeper look at one of the most crucial traffic sources, check out our guide on what is organic traffic.
Keeping Pace with a Crowded Digital World
The internet is a noisy place, and it's only getting louder. Global internet traffic recently jumped by 19%, driven by everything from AI bots and the massive shift to mobile browsing to new connectivity from services like Starlink.
For your business, this means it's easier than ever for your website to get lost in the shuffle. Without actively tracking your visitor trends and on-site behavior, you're flying blind.
By monitoring your web traffic, you're not just counting visitors; you're listening to your customers. Every session, click, and conversion is a piece of feedback that tells you what's working and what isn't.
At the end of the day, knowing how to monitor your traffic is all about understanding your audience on a much deeper level. That understanding is what allows you to make smarter, data-driven decisions that lead directly to more sales and sustainable growth for your restaurant equipment business.
Laying the Groundwork with Google Analytics 4
Before you can get any meaningful data, you need a tool to actually collect it. The go-to for pretty much everyone in e-commerce is Google Analytics 4 (GA4). It’s powerful, it’s free, and it’s the bedrock for making smart decisions about your restaurant equipment business. Getting this set up right from the start is non-negotiable.
First things first, you'll create a new GA4 "property" inside your Google Analytics account. It helps to think of the account as your whole business (e.g., "Main Street Restaurant Supply") and the property as the specific website you're tracking (e.g., "mainstreetrestaurantequipment.com"). This little distinction becomes a lifesaver if you ever launch a second site or a blog under the same company umbrella.
After creating the property, Google gives you a unique Measurement ID and a small block of tracking code. That code is the magic ticket—it’s a snippet of JavaScript that you need to get onto every single page of your website. It’s what tells Google Analytics, "Hey, someone's here!" every time a visitor lands.
Getting the Tracking Code on Your E-commerce Site
Thankfully, you don’t need to be a developer to get this done. Most modern e-commerce platforms are built to play nice with analytics tools.
- If you’re on Shopify: Just head to your Online Store settings, find the “Google Analytics” section, and pop in your GA4 Measurement ID. That’s it. Shopify takes care of injecting the code everywhere it needs to be.
- For WooCommerce users (on WordPress): The path of least resistance is using a plugin. Something like Google Site Kit or GTM4WP makes this a breeze. They give you a simple field to paste your Measurement ID, and the plugin handles the technical part of putting the script in the right place.
Once you’ve installed it, you have to verify it’s working. The "Realtime" report in GA4 is your best friend here. Open your own website in a different browser window and then watch the report. Seeing that little "1" show up under "Users in Last 30 Minutes" is your green light. It means you’re officially collecting data. For a deeper dive into this part of the process, you can find more on the specifics of finding your analytics tracking ID.
My two cents: Don't just check your homepage and call it a day. Click around. Go to a high-traffic category page, like your commercial refrigerators, and then drill down to a specific product page, like a best-selling walk-in cooler. This confirms the tracking is firing across the entire customer journey, not just at the front door.
What About GA4 Alternatives?
While GA4 is the 800-pound gorilla in the room, it's not your only option. Depending on what you value most—simplicity, privacy, data ownership—another tool might be a better fit for monitoring your traffic.
| Analytics Platform | Best For | Key Differentiator |
|---|---|---|
| Google Analytics 4 | Businesses wanting deep, comprehensive data and tight integration with Google's ad ecosystem. | The most powerful and feature-rich free platform you can get. |
| Matomo | Businesses that need full data ownership and prefer to host analytics on their own server. | It’s all about data privacy, giving you 100% control over your visitor information. |
| Plausible Analytics | Sellers who want simple, at-a-glance metrics without getting bogged down in complexity. | A lightweight, privacy-first tool that puts the most important data on a single screen. |
The choice usually comes with a trade-off. Plausible, for instance, is beautifully simple but doesn't have the heavy-duty e-commerce tracking that GA4 offers. Matomo gives you ultimate control but demands more technical know-how for setup and maintenance.
For the vast majority of restaurant equipment sellers, especially those just getting their feet wet with analytics, GA4 is still the way to go. Its deep ties to Google Ads and powerful e-commerce features are built from the ground up to help you measure what matters and grow your sales.
With this foundation in place, you’ve officially built your data collection engine. The system is now listening, recording visitor actions, and organizing that information for you. The next step is to start telling it which specific actions are most important to your business, transforming it from a simple traffic counter into a true sales intelligence tool.
Tracking the Metrics That Actually Drive Sales
Having a steady stream of visitors is a good start, but it doesn't pay the bills. The real magic of web analytics happens when you understand the specific actions people take on their way to making a purchase. This is where we go beyond simply counting page views and start tracking the metrics that directly impact your bottom line.
The key to this is setting up what’s called event tracking in Google Analytics 4 (GA4). Just think of an "event" as any meaningful interaction a user has on your site that isn’t just loading a page. For a restaurant equipment seller, these are the digital breadcrumbs that tell you a potential customer is getting serious.
This whole process really boils down to three foundational steps.
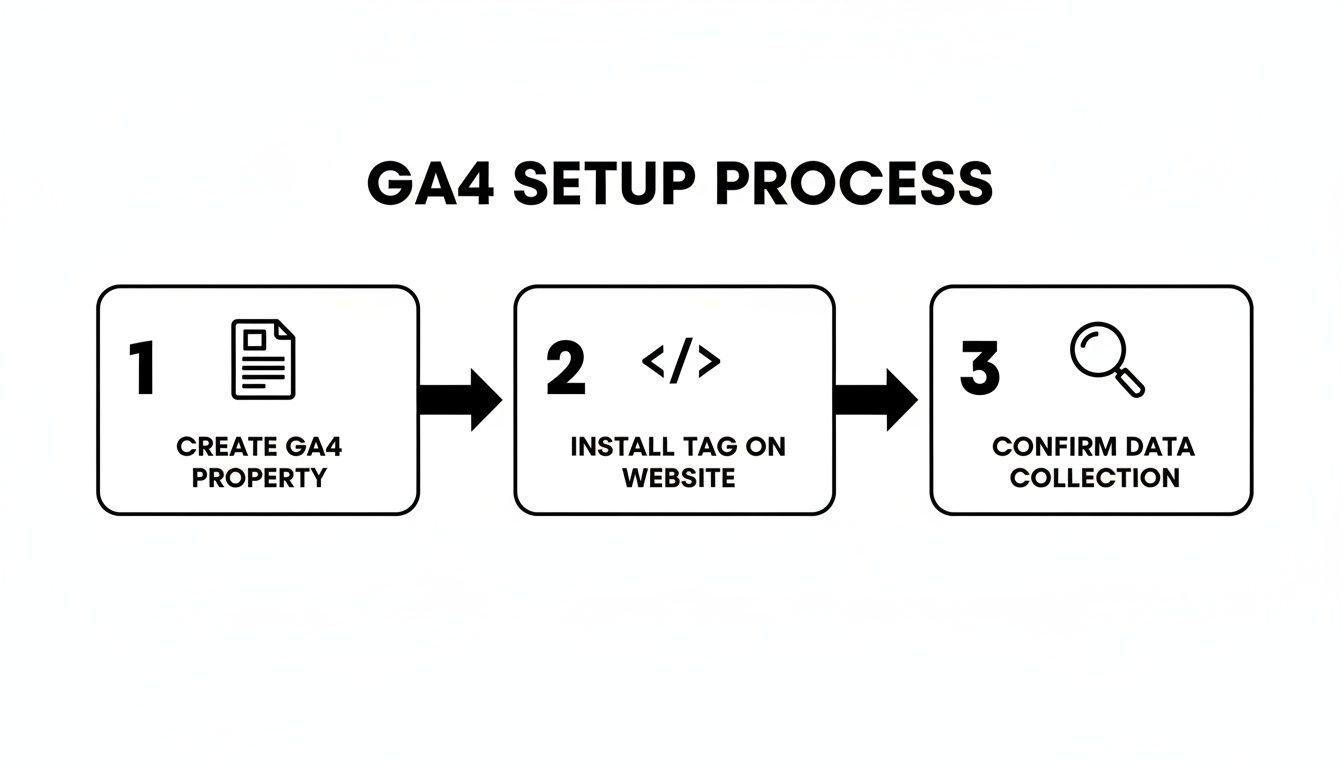
As the visual shows, it’s a straightforward sequence: create your GA4 property, get the tracking tag installed on your website, and then make sure the data is actually flowing in.
From Clicks to Conversions with Event Tracking
So, what kinds of events are worth tracking for an equipment seller? You want to zero in on interactions that signal real buying intent.
Here are a few prime examples I always recommend:
- Downloading a Spec Sheet: A chef downloading the PDF for a commercial convection oven is a huge tell. They're doing their research.
- Watching a Product Demo: If someone sits through the video for a new combi oven, they're actively evaluating its features for their kitchen.
- Clicking "Get a Quote": This is a direct request for pricing—one of the most valuable pre-purchase actions you can possibly track.
- Using a Financing Calculator: Anyone engaging with a financing tool is not just window shopping; they are planning a significant investment.
By tracking these specific events in GA4, you transform your analytics from a passive report into an active sales intelligence tool. You can start to see which products generate the most interest and spot friction points. For instance, if you see lots of demo views but no "add to cart" clicks, something might be off with your pricing or product description.
Activating Full E-commerce Tracking
While tracking interest is powerful, the ultimate goal is to see the entire sales journey. This is where you need to enable enhanced e-commerce tracking in GA4. Thankfully, most modern e-commerce platforms like Shopify or WooCommerce have plugins or built-in integrations that make this pretty simple, automatically pushing crucial transaction data to your analytics.
Once you have it turned on, you can track the entire customer journey through these key e-commerce events:
- view_item: Someone looks at a specific product page, like a three-door commercial refrigerator.
- add_to_cart: They decide they're interested and click to add the item to their shopping cart.
- begin_checkout: The user starts the checkout process, a clear sign of high purchase intent.
- purchase: The final, most important conversion—the sale is complete.
By monitoring these four events, you can build a complete sales funnel report. This is how you pinpoint exactly where you're losing potential customers. Are they adding items to the cart but never starting checkout? That could point to a surprise shipping cost or a clunky account creation process.
This level of detail isn't a "nice-to-have" for a growing online equipment store; it's essential. It gives you the hard data needed to make smart decisions, fix your checkout process, and ultimately boost your conversion rate.
Pinpointing Your Most Valuable Marketing with UTMs
Okay, so you're tracking what happens on your site. The final piece of the puzzle is understanding why it's happening. Which of your marketing efforts are actually driving these valuable sales and events? The answer lies in using UTM parameters.
UTM parameters are just simple tags you add to the end of a URL that tell Google Analytics exactly where that visitor came from. Think of it as putting a unique tracking number on every single link you share online.
For example, instead of linking to your new ice machine page like this:
https://yourstore.com/ice-machines/new-model
You’d use a link like this in your email newsletter:
https://yourstore.com/ice-machines/new-model?utm_source=email&utm_medium=newsletter&utm_campaign=july_promo
That tagged link tells GA4, without a doubt, that anyone who clicks it came from your July promo newsletter. Now you can see not just how many people clicked, but how many of them went on to download a spec sheet, add an item to their cart, and ultimately make a purchase. This is how you calculate the real ROI for every campaign, from your social media ads to posts on partner blogs.
This kind of detailed monitoring is more critical than ever. Recent data reveals that traffic to top websites fell over 11% in the five years leading up to 2025. Combine that with "web rot"—the fact that 25% of webpages from a decade ago are now inaccessible—and it's clear why you need to know what's working now. You can learn more about these website traffic trends and their implications. By using UTMs, you can identify which channels are still delivering and which are fading, making sure your marketing budget is always working its hardest for you.
Building Your Custom Sales Performance Dashboard
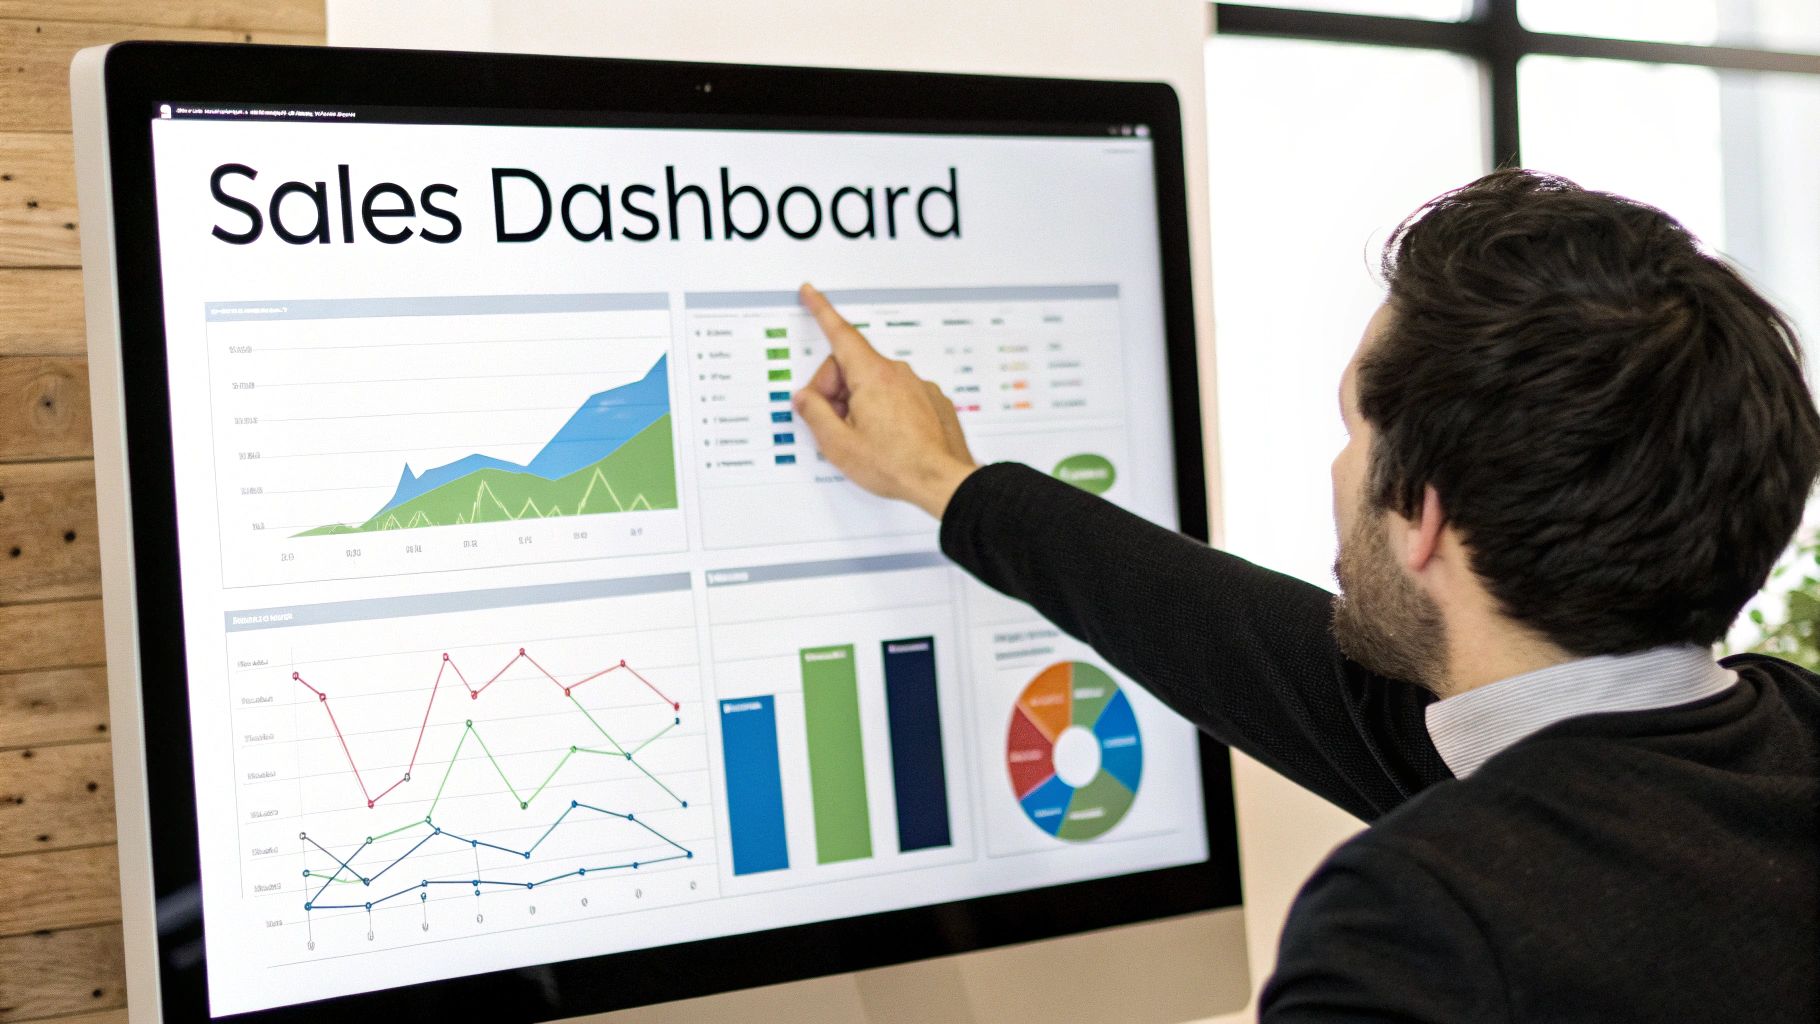
Alright, you've got accurate e-commerce and event data flowing into Google Analytics 4. That's a huge step, but raw data is just a jumble of numbers. Now, we need to turn that information into a clear, actionable picture of your business. The goal is to build a custom dashboard that tells you the story of your sales performance at a glance.
Think of this dashboard as the mission control for your online store. It’s the single screen where you can instantly see which products are hot, where your best customers are coming from, and how your marketing efforts are actually translating into revenue.
This isn't about tracking every metric under the sun. It's about being laser-focused on the specific Key Performance Indicators (KPIs) that directly impact your bottom line as a restaurant equipment seller.
What to Actually Put on Your Dashboard
Before you start dragging and dropping widgets in GA4, you have to decide what’s worth measuring. For an e-commerce business in the food service industry, a handful of metrics are absolutely non-negotiable.
These are the KPIs that give you a high-level overview of your business health before you dive into the nitty-gritty.
Essential KPIs for Restaurant Equipment Sellers
The table below breaks down the most critical metrics you should be tracking. These are the numbers that tell you if you're just busy or if you're actually profitable.
| KPI (Key Performance Indicator) | What It Measures | Why It Matters for Your Store |
|---|---|---|
| Total Revenue | The top-line sales figure before expenses. | The most straightforward measure of business performance. Is it growing month-over-month? |
| Conversion Rate | The percentage of website visitors who make a purchase. | A direct indicator of your site's effectiveness. A low rate might mean pricing, UX, or trust issues. |
| Average Order Value (AOV) | The average dollar amount spent each time a customer places an order. | Shows if customers are buying single parts or full kitchen packages. A rising AOV is a sign of successful upselling. |
| Top Selling Products | Which specific items are driving the most revenue. | Tells you what to stock, promote, and feature. Is that countertop fryer really your star player? |
| Cart Abandonment Rate | The percentage of shoppers who add items to their cart but don't complete the purchase. | High abandonment can signal problems with shipping costs, checkout complexity, or unexpected fees. |
Keeping a close eye on these five metrics is the foundation of a dashboard that truly works for your business.
Visualizing the Customer Journey: Where Are Sales Coming From?
Beyond the core sales numbers, your dashboard needs to show you how those sales are happening. This is where you visualize the sources of your traffic to understand which channels are the most profitable—and it's precisely where that UTM tracking we set up earlier really pays off.
You can create widgets that break down your sales by Traffic Source/Medium. This is incredibly powerful because it lets you directly compare the performance of your different marketing channels.
For example, your dashboard might reveal that:
-
google / organic(SEO) brings in the most traffic but has a moderate conversion rate. -
google / cpc(Google Ads) has less traffic but a sky-high conversion rate for specific keywords like "commercial ice machine." -
email / newsletterdrives a huge spike in sales for the 24 hours right after you send a promotion.
This kind of insight is pure gold. It tells you exactly where to invest your marketing budget for the best return. If organic search is consistently bringing in qualified buyers, it’s a clear signal to double down on your SEO efforts.
A dashboard isn’t just a report; it’s a decision-making tool. If you see high traffic to your pizza oven pages but zero sales, that’s not a failed metric—it’s an actionable signal to investigate your pricing, shipping costs, or the user experience on that specific page.
Adding Product and Device-Level Insights
Finally, a truly effective dashboard gets granular. You need to understand performance at the individual product level. Don't just look at top-sellers by revenue; create a table that also includes metrics like Views and Add-to-Carts.
This simple addition can uncover hidden opportunities. A product with tons of views but few add-to-carts might have an unclear description, poor-quality photos, or be priced just a bit too high. That's a problem you can actively solve.
Another critical layer is understanding device performance. You have to know how customers are shopping because, let's be real, many of them are making decisions on the go. A restaurant manager is far more likely to be scouting for 'stainless steel prep tables' on their phone during a break than sitting at a desktop.
By the second quarter of 2025, mobile devices are projected to account for 62.54% of all global website traffic. This isn't a trend; it's the new standard. For more context, check out these mobile traffic statistics and their business impact. Tracking mobile-specific metrics like bounce rates and session durations can reveal if your pages are loading fast enough and are easy to navigate on a small screen.
By combining top-line KPIs with traffic source data and device-specific insights, you build a comprehensive dashboard that moves beyond simple numbers. It becomes a dynamic tool that gives you a clear, 360-degree view of your sales performance, helping you make smarter, faster decisions to grow your restaurant equipment business.
Solving Common Tracking Problems
So you've got your analytics set up. That's a huge step. But what do you do when the numbers just look... off?
Even the most meticulous setup can have hiccups. You might see phantom traffic spikes, or your sales figures in analytics don't line up with your actual bank deposits. Don't worry, this is a completely normal part of the process. Troubleshooting is how you really learn the ropes of monitoring your web traffic.
The trick is to approach it methodically, like a detective. Most tracking issues are common and have surprisingly straightforward fixes. This isn't just about cleaning up your reports; it's about gaining a much deeper understanding of how all these moving parts connect.
Diagnosing Inaccurate Traffic Numbers
One of the most common issues I see is traffic data that just doesn’t feel real. Maybe you see a sudden, massive surge in visitors from a country where you don't even ship, or your referral report is clogged with bizarre, spammy-looking websites.
Nine times out of ten, this is bot traffic or referral spam. These aren't potential customers; they're just automated scripts crawling the web. They can seriously inflate your metrics and make it impossible to know how your marketing is actually performing.
Here’s where you can start to clean things up:
- Filter Known Bots in GA4: Google has a built-in setting to automatically exclude traffic from known bots. It's a simple checkbox in your Data Stream settings that can solve a huge chunk of these problems right away. Make sure it's turned on.
- Create IP Exclusions: Noticing a lot of activity from a single IP address? It could be your own office or your web developer. You can create a filter to exclude that traffic so your team’s daily activity doesn't accidentally skew your customer data.
- Set Up Referral Exclusions: If you keep seeing junk sites in your referral report, you can add them to an exclusion list. This tells GA4 to simply ignore any traffic coming from those domains.
By filtering out this digital noise, you get a much clearer, more honest look at your real audience—the actual chefs and restaurant owners visiting your site.
When Sales Data Doesn't Match
Another classic headache: your GA4 e-commerce report shows a different number of sales or a different revenue total than your Shopify or BigCommerce backend. A tiny variance can be normal, but if the gap is significant, you likely have a tracking problem.
This usually happens when the tracking code doesn't fire for every single transaction. A customer might close their browser tab a split-second too early after paying, or an ad-blocker extension on their browser might stop the script from running.
Pro Tip: Your best friend here is Google's free Tag Assistant extension for Chrome. It lets you see exactly which tags are firing on your site in real-time. Go through your own checkout process, make a test purchase, and watch to see if the
purchaseevent fires correctly on the final "thank you" page. If it doesn't, you've found the source of the leak.
The fix often lies in your e-commerce platform's integration settings. You need to ensure the transaction data is sent after the payment is fully confirmed, not before. For more complex issues that aren't visible from the browser, you might need to dig deeper. You can learn more about how to analyze log files to spot server-side problems that other tools will miss.
Taking Action on Your Findings
Troubleshooting isn't just about fixing broken code; it's about finding real opportunities to improve your business. Once your data is clean and reliable, you can finally trust what it’s telling you and make smart, confident decisions.
Let's say you fix a tracking bug and get accurate data on your commercial mixer pages. You discover that the main category page has a 75% bounce rate. That means three out of every four people who land there leave without clicking on a single product. That's no longer a technical problem—it's a business problem.
Now you can start asking the right questions:
- Are the product photos compelling? We need high-resolution images showing the mixers from every angle, maybe even in a kitchen setting.
- Could we add a video? Showing a powerful mixer in action is far more persuasive than just listing its specs.
- Is the technical information clear? Horsepower, capacity, and electrical requirements need to be front and center, easy for a busy chef to find.
By methodically working through tracking issues, you build a foundation of data you can trust. That trust allows you to shift your focus from fixing glitches to making strategic improvements that genuinely help your customers and, ultimately, drive more sales.
Got Questions? We’ve Got Answers.
Even with the best analytics setup, you're bound to have questions as you start digging into the data. Let's tackle some of the most common ones we hear from restaurant equipment sellers.
How Often Should I Really Be Looking at This Stuff?
There's no magic number here—it all comes down to your current marketing efforts and business goals. But if you're looking for a solid routine, here’s a cadence that works well for most businesses.
Try a quick daily glance at your main dashboard. You’re just looking for red flags—a sudden nosedive in traffic or a weird spike that might signal a problem. Then, set aside time for a more focused weekly review to see how your campaigns are tracking. Finally, block off a couple of hours each month for a deep dive to analyze the bigger picture and shape your strategy for the next 30 days.
For example, that daily check could catch a viral blog post you need to promote harder, or it might expose a wave of bot traffic you need to filter out. Your weekly check-in is perfect for seeing if that email blast actually drove sales. The monthly report is where you step back and ask the big questions, like whether your SEO investment is paying off better than your Google Ads spend.
Think of it like managing your kitchen inventory. You do quick daily spot-checks, a more formal weekly count, and a comprehensive monthly audit. Apply that same rhythm to your data, and you'll stay on top of things without getting buried in spreadsheets.
What's a Good Bounce Rate in the Restaurant Equipment World?
This is a tricky one, because a "good" bounce rate is all about context. Think about it: a chef could land on a product page for a combi oven, find the exact spec sheet they need, download it, and leave. That’s a bounce, but it's a successful visit! They got what they came for.
That said, if you need some general benchmarks for e-commerce in our niche, here’s a rough guide:
- Below 40%: Fantastic. Your visitors are clearly engaged and exploring your site.
- 40% to 55%: A perfectly healthy and average range.
- Above 60%: This might be a signal to investigate. You could have issues with slow page load times, a clunky user experience, or a disconnect between your ad copy and what's actually on the landing page.
Instead of getting hung up on a single percentage, look at where it's happening. A high bounce rate on your homepage is a much bigger deal than one on a product page that features a downloadable PDF.
Can I Actually Trust the Data I'm Seeing in Google Analytics?
Absolutely—with one massive "if." You can trust the data if it's being collected correctly. Google Analytics is an incredibly robust tool, but it's a classic case of garbage in, garbage out. A poorly configured tracking code, unfiltered bot traffic, or missing e-commerce events will give you a skewed view of reality.
This is precisely why we spent so much time on the setup and troubleshooting steps earlier. Once you've verified that your tracking is firing properly from the first click to the final sale, and you have filters in place to screen out your own team's activity and junk traffic, you can rely on the data with confidence.
When it's set up right, GA4 becomes your single source of truth for making smart business decisions. It gives you a clear, accurate picture of how real customers are interacting with your site—and that's the foundation of effective web traffic monitoring.
Ready to turn your website data into a powerful sales engine? Restaurant Equipment SEO specializes in creating data-driven strategies that help sellers in the food service industry dominate search rankings and attract qualified buyers. We use advanced analytics to pinpoint opportunities and drive sustainable growth.
Discover how our expertise can increase your online visibility by visiting us at https://restaurantequipmentseo.com.