
Unlocking SEO Insights with Log File Analysis
Log file analysis gives you a completely unfiltered view of how search engines like Google actually see and interact with your website. You're not looking at sampled data or educated guesses from other tools; you're seeing the ground truth—every single request Googlebot makes. It’s a direct, factual record of crawler behavior.
Why Log Data Is a Goldmine for Technical SEO
Standard SEO tools are indispensable, but they often provide summaries or estimations of what crawlers are doing. Think of Google Search Console's Crawl Stats report as the highlight reel; your server logs are the full, unedited game footage. This raw data is where you'll find the subtle yet critical insights that can make or break your technical SEO performance.

The distinction is crucial. While other platforms can flag potential issues, log file analysis confirms them with undeniable proof. For a restaurant equipment site, this could mean discovering that Googlebot is wasting 50% of its crawl budget on old, out-of-stock product pages instead of your new, high-margin commercial ovens. You wouldn't see that precise waste in most dashboards.
Uncovering the Hidden Truth
Log files provide concrete answers to fundamental SEO questions that other tools can only guess at. By digging into this data, you can see what's really happening under the hood.
Here's what you'll be able to do:
- Verify True Crawl Frequency: See exactly how often Googlebot is visiting your most important pages versus low-priority URLs.
- Identify Wasted Crawl Budget: Pinpoint where search engines are spending precious time on non-indexable pages, redirect chains, or messy parameter-heavy URLs.
- Discover Unknown Errors: Find server-side issues like soft 404s or temporary errors that crawlers encounter but aren't always reported elsewhere.
-
Validate Technical Fixes: Confirm if that new
robots.txtrule or canonical tag update actually changed crawler behavior like you intended.
This level of detail lets you shift your strategy from being reactive to proactive. You're no longer just monitoring SEO health; you're actively directing it. If you're interested in the broader context of how this works, understanding the principles of network traffic analysis provides deeper insights into the data flows that server logs reveal.
By analyzing log files, you shift from hoping search engines understand your site structure to knowing exactly how they navigate it, hit by hit. This is the foundation of truly effective technical SEO.
The table below breaks down the unique, actionable information you get from logs versus what typical SEO tools provide.
Key Insights Unlocked by Log File Analysis
| Critical SEO Question | What Log Files Show You | Actionable Outcome |
|---|---|---|
| Which pages are actually being crawled? | The exact URLs, hit timestamps, and frequency for every single crawler request. | Discover if high-priority pages are ignored or if crawl budget is wasted on junk URLs. |
| How frequently is my site being crawled? | A precise count of Googlebot hits per day, per hour, and per URL. | Identify crawl rate issues, like too many or too few requests, and spot changes after site updates. |
| Are crawlers hitting server errors? | The specific status codes (e.g., 500s, soft-404s) served to search bots. | Uncover "invisible" errors that hurt indexing but don't show up for human users. |
Are my robots.txt rules working? |
Logs show if blocked URLs are still being requested, confirming misconfigurations. | Validate that your directives are being respected and adjust them to guide crawlers effectively. |
As you can see, the data is far more granular and provides a level of certainty that's impossible to get elsewhere.
The growing importance of this practice is reflected in the market. The log management market is projected to grow by USD 3,228.5 million between 2025 and 2029, as more businesses rely on this data for everything from security to operational efficiency.
Ultimately, integrating findings from your log analysis will help you refine your entire reporting process, giving you a much more accurate way to measure your SEO performance.
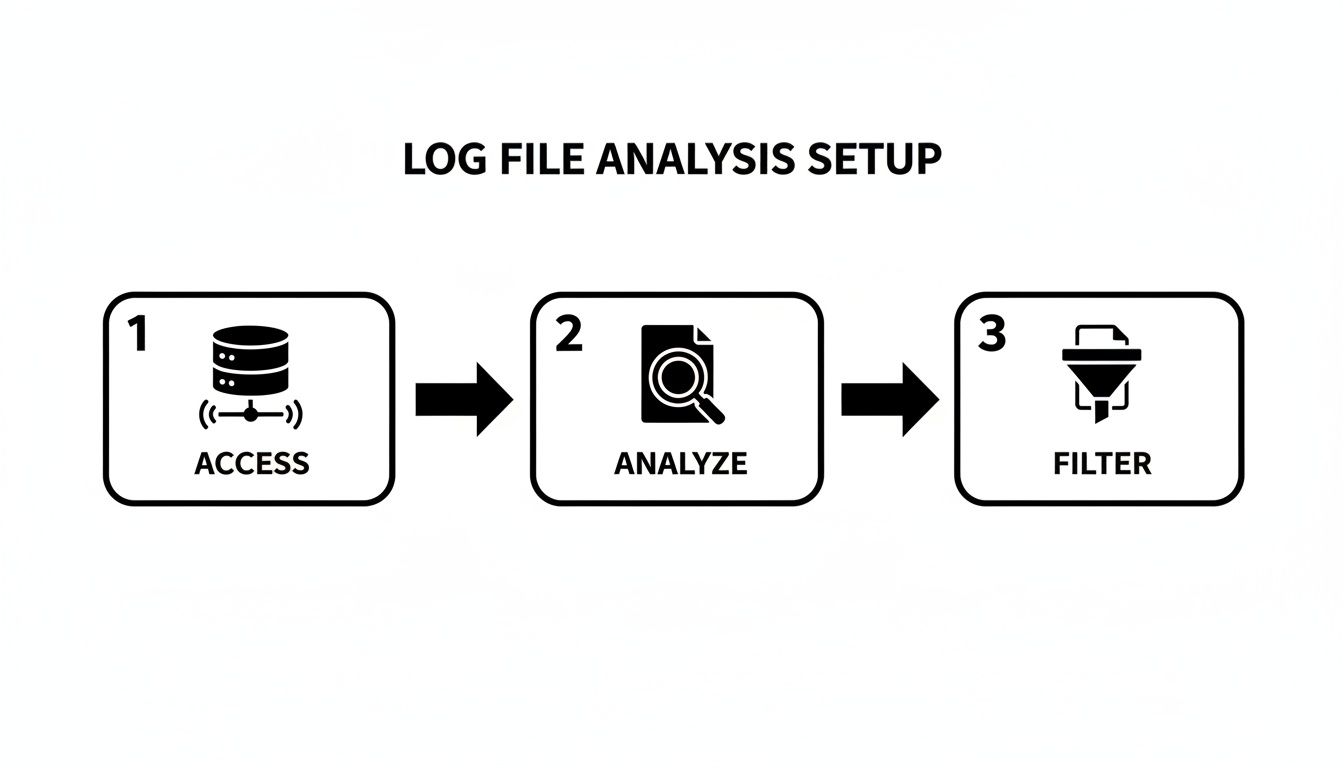
Setting Up Your Log File Analysis Workflow
Diving into log file analysis can feel intimidating, but at its core, it’s a pretty straightforward process. The first hurdle is just getting your hands on the raw data, and how you do that really comes down to your hosting setup.
If you’re on a managed hosting plan, the path of least resistance is usually to pop in a support ticket. Just ask for the raw access logs for a specific date range. Pro tip: request an uncompressed format like .log or .txt if you can—it'll make your life easier. For those with cPanel or Plesk access, you'll probably find a "Raw Access Logs" or "Logs" icon in your dashboard to download them directly. And if you have the keys to the kingdom (server admin access), you can just SSH in and pull the files yourself.
Choosing Your Log Analysis Tool
Once you have the log files, you've got to make sense of the millions of lines of text. Don't even think about doing this by hand. You need a specialized tool. The market for these tools is booming—it was valued at around USD 0.8 billion in 2024 and is projected to hit USD 1.81 billion by 2033. That growth means we have some seriously powerful options available now.
For SEO work, your choice usually hinges on your technical chops and what you’re willing to spend.
- Screaming Frog Log File Analyser: This is the go-to for most SEOs for a reason. It's affordable, built for SEO, and integrates beautifully with the Screaming Frog SEO Spider to merge log data with your crawl data. It just works.
- Splunk: Think of Splunk as the enterprise-grade beast of data platforms. It can chew through enormous datasets in real time, but it's a lot more than just an SEO tool. The learning curve is steep, and so is the price tag.
- ELK Stack (Elasticsearch, Logstash, Kibana): This is the powerful, open-source option for those who don't mind getting their hands dirty. It requires some technical skill to set up, but the customization for querying and visualizing your data is second to none.
Getting these tools to process your data is a lot like learning how to build a robust data pipeline; you’re taking raw, messy information and turning it into something structured and incredibly useful.
From Raw Data to Actionable Insights
The real magic happens when you turn that chaotic log file into a clean, focused view of search engine activity. The entire goal here is to filter out the noise—human visitors, your office IP, random bots—so you can see exactly what Googlebot, Bingbot, and other crawlers are up to.
This dashboard from the Screaming Frog Log File Analyser is a perfect example of your first look. It gives you a quick snapshot of total events, verified bots, and response codes, which is exactly where you want to start before you go digging deeper.
Here’s what that workflow looks like in practice:
-
Import and Merge: First, you'll load your raw log files into your tool. The crucial next move is to import a complete crawl of your site (from Screaming Frog SEO Spider, for instance) and merge the two. This is non-negotiable. It's the only way to see not just what Google is crawling, but more importantly, what critical pages it isn't.
-
Filter for the Real Bots: Next, set up the tool to verify search engine bots using a reverse DNS lookup. This step is vital for making sure you’re looking at legitimate Googlebot activity and not just some scraper spoofing its user-agent.
-
Cut Out the Noise: Finally, filter out any requests coming from your own company's IP addresses and any traffic from non-essential bots. This purifies your dataset, leaving you with a clean look at genuine crawler interactions.
Follow these steps, and you’ll transform an overwhelming text file into a focused dataset brimming with SEO insights. This is just one piece of a much larger data strategy, of course. If you need a refresher on getting your other tools in order, our guide on finding your analytics tracking ID can help ensure your data collection is solid across the board.
Finding Actionable SEO Wins in Your Log Data
You’ve got your log files collected and cleaned up. Now, the real work begins—this is where you stop being a data processor and start being a detective. Your logs tell the unfiltered story of how search engines see your website, and our job is to read between the lines to find those game-changing SEO opportunities.
The whole process is about refinement. You start with a mountain of raw data and systematically filter out the noise until only the most important signals from search bots remain.
It's no surprise that the demand for this kind of deep analysis is exploding. The global log analysis market is projected to skyrocket to $12,500 million by 2025. Businesses are waking up to the fact that this data is critical for everything from security to operational uptime. In fact, some companies are using it to cut downtime by up to 50%, which shows just how powerful these insights can be.
Pinpointing Crawl Budget Waste
One of the quickest and most impactful wins you can get from your logs is spotting crawl budget waste. Google gives you a finite number of URLs it's willing to crawl in a given period. You need to make every single one of those hits count.
Keep an eye out for URLs that Googlebot visits over and over again but that provide zero value to your SEO efforts. The usual suspects include:
-
Faceted Navigation: Think of all those URLs with parameters like
?color=stainless-steelor?brand=true-refrigeration. They can generate thousands of near-duplicate pages that just devour your crawl budget. - Session IDs: Some older platforms still tack on session IDs, creating a unique URL for every single visit. It’s a classic crawl trap.
- Internal Site Search Results: The pages generated when someone uses your on-site search bar are almost never something you want Google to index.
- Infinite Scroll: If it’s not set up with proper pagination, crawlers can get caught in an endless loop, wasting valuable resources.
On a restaurant equipment site, you might find that Googlebot is spending a whopping 30% of its time crawling filtered URLs for "commercial refrigerators by cubic feet." Meanwhile, your brand new, high-margin pizza oven category is getting ignored. That’s your cue to block those parameters in your robots.txt file—yesterday.
Analyzing Status Codes for Hidden Problems
Your log files are the ultimate source of truth for every HTTP status code your server sends to a search bot. A standard site audit might find a few broken links, but log analysis uncovers the issues that other tools completely miss.
Log files don't just show you the errors you know about; they reveal the errors you didn't even know you had. They expose the subtle, intermittent issues that slowly degrade your site's health and are only visible to crawlers.
Here’s what to hunt for:
- Widespread 404s on valuable pages: If you see Googlebot repeatedly hitting a 404 on a page that used to be important, you have a major internal linking or backlink problem. That’s a signal to implement a 301 redirect right away.
- Sudden spikes in 5xx server errors: These are server-side problems. If Googlebot runs into these too often, it’s going to assume your site is unstable and will likely pull back on crawling.
- The elusive "Soft 404": This one is sneaky. The server returns a 200 OK status code, but the page itself is empty or says "Product Not Found." A typical crawler sees the 200 code and moves on, but your logs show you that Googlebot visited, and you can bet it flagged the page as a soft 404 in Search Console. Finding these in your logs helps you fix them before they become a massive indexing headache.
Auditing Crawl Frequency and Priorities
This is where log file analysis gets really strategic. Seeing how often Google crawls certain parts of your site gives you direct insight into what it thinks is important. When Google’s priorities don’t match your business priorities, you’ve got a problem.
Start by breaking down your URLs into segments: product pages, category pages, blog posts, etc. Then, look at the crawl distribution. You might be shocked by what you find.
For example, you might discover:
- Your "About Us" and "Privacy Policy" pages are getting crawled every single day.
- Your new, high-priority "Commercial Ice Machines" category page has only been seen once in the last month.
That’s a massive red flag. It tells you your internal linking and site architecture are failing to signal the importance of your core money-making pages. The immediate fix is to start adding more internal links from high-authority pages (like your homepage) to these under-crawled, high-value pages. This simple tweak can often shift Googlebot’s attention in a matter of weeks, leading to better indexing and rankings for the pages that actually drive revenue.
To help connect the dots, here’s a quick-reference guide linking common patterns you might find in your logs to specific, high-impact SEO actions.
Common Log File Patterns and Strategic SEO Responses
| Log File Finding | What It Means for SEO | Your Next Action |
|---|---|---|
| High crawl rate on pages with URL parameters | Crawl budget waste. Google is spending time on low-value, duplicate pages instead of your important content. | Use robots.txt to disallow crawling of specific parameters. Set up parameter handling rules in Google Search Console. |
| Frequent 404 errors on old, important URLs | Link equity loss. You're losing the value from internal links and backlinks pointing to a page that no longer exists. | Implement 301 redirects from the old URLs to the most relevant live pages. |
| Spike in 5xx server errors | Site instability. Google sees your site as unreliable, which can lead to reduced crawl rates and ranking drops. | Send the logs to your development or hosting team to diagnose and fix the underlying server issue. |
| Googlebot isn't crawling new, high-priority pages | Poor internal linking. Your site architecture isn't signaling the importance of your key commercial pages. | Add prominent internal links from your homepage and other high-authority pages to the new content. Update your XML sitemap. |
| Googlebot crawls a URL, but it’s a "soft 404" | Indexing problem. You have pages that appear "live" but offer no value, confusing both users and search engines. | Either configure the server to return a proper 404/410 status code or add valuable content to the page. |
Treat this table as your initial checklist. When you spot one of these patterns, you know exactly what to do next to turn that data into a tangible SEO improvement.
How to Prioritize Your Log File Fixes for the Biggest Wins
Finding problems in your server logs is one thing. Actually knowing what to fix first? That’s the real challenge. A giant list of every single issue you uncover is just noise. What you need is a game plan, a way to cut through that noise and focus on the fixes that will actually move the needle for your SEO.
This is where I always lean on a simple but incredibly effective framework: the Impact vs. Effort Matrix. The whole idea is to map out every potential fix based on how much it will help your SEO (the impact) against how much time and resources it’ll take to get it done (the effort). This simple exercise is what separates busy work from genuinely productive work.
Start with the Quick Wins and Build Momentum
Your first move should always be to go after the low-hanging fruit. These are the tasks that fall squarely in the High-Impact, Low-Effort box. Think of them as the quick wins that can immediately boost your crawl efficiency and overall site health without needing to kick off a massive development project.
For a big e-commerce site like one selling restaurant equipment, this is where you can make a real difference, fast. A perfect example is discovering that Googlebot is wasting thousands of requests on your faceted navigation URLs. This is a classic high-impact problem. The fix? A few quick lines in your robots.txt file to block those parameters. That’s a low-effort task that can take just a few minutes but saves a massive amount of crawl budget.
Here are a few other common quick wins I see all the time in log files:
- Blocking Junk Parameter URLs: As mentioned, telling crawlers to ignore URLs cluttered with session IDs, filters, or internal search parameters is one of the fastest ways to preserve your crawl budget.
- Redirecting Old Pages Getting Tons of Hits: Are your logs showing Googlebot hammering old, long-gone product pages hundreds of times a day? A simple 301 redirect is a high-impact fix that immediately reclaims all that wasted crawl equity.
- Fixing a Widespread 404 Error: A few random 404s are no big deal. But when your logs show crawlers constantly hitting a broken link that’s part of a sitewide template—like in the header or footer—fixing that one element is a low-effort task with a huge impact.
The point of log file analysis isn't just to find problems; it's to find the right problems. A single, well-placed
robots.txtdirective often has a bigger SEO impact than fixing a hundred one-off broken links.
By tackling these items first, you build momentum. You can often see positive changes in your crawl stats reports within just a few weeks, which is great for justifying the resources needed for those bigger, more complex tasks down the road.
Turning Your Findings into an Action Plan
Once you’ve got your list of issues, you need to turn it into something your team can actually use. Don't just email a spreadsheet full of URLs to your developers and hope for the best. Group related issues into clear, specific tasks and—most importantly—give them the context from your log analysis.
For our restaurant equipment site, a solid action plan might look something like this:
| Priority | Task Description | Finding from Log Analysis | Estimated Effort | Potential Impact |
|---|---|---|---|---|
| P1 | Block faceted navigation parameters in robots.txt. |
45% of Googlebot hits are on /commercial-refrigerators?brand=... URLs. |
Low (1-2 hours) | High |
| P1 | Redirect the top 25 legacy URLs to new category pages. | Logs show 500+ daily hits on old /coolers-and-freezers/ URLs, all serving 404s. |
Low (2-4 hours) | High |
| P2 | Investigate the recent spike in 503 server errors on the checkout flow. | Googlebot hit over 2,000 503 errors on checkout pages in the last 7 days. | High (Dev team) | High |
| P3 | Update internal links pointing to the old blog to the newly migrated section. | Crawl data shows Googlebot hasn't visited the new /blog/ section in 30 days. |
Medium (4-8 hours) | Medium |
| P4 | Clean up isolated 404s for discontinued product pages. | We found ~50 individual 404s on old product pages with very low crawl frequency. | Medium (4-8 hours) | Low |
This kind of structured approach transforms your raw log data into a strategic roadmap. It doesn't just say what needs to be done; it shows why it matters, with hard evidence to back it up. This clarity is absolutely essential for getting buy-in from developers and stakeholders, ensuring your insights actually lead to real improvements.
Presenting Your Findings to Stakeholders
All that hard work digging through log files means nothing if you can't get anyone to act on what you found. Your technical discoveries have to be translated into a clear business case that resonates with executives, clients, and developers—people who don't live and breathe SEO. The real goal here is to move past the jargon and build a compelling story that drives action.

A great report isn't a data dump. It's a strategic document built for clarity and impact. My advice? Start with the conclusion.
Lead with a tight executive summary that immediately flags the top three most critical findings and what you recommend doing about them. Stakeholders are busy. Giving them the key takeaways upfront ensures your most important message lands, even if they just skim the rest.
This summary sets the stage for all the detailed evidence that follows. It reframes a list of technical problems into a high-level strategic overview, highlighting things like wasted resources, missed opportunities, and potential revenue loss.
Structuring Your Log File Analysis Report
To build a narrative that actually makes sense, you need to structure your report with distinct sections. This approach guides your audience from the big picture down to the nitty-gritty, evidence-backed recommendations, making it far easier for them to get why your findings matter.
A well-organized document keeps people from getting overwhelmed. A developer might jump straight to the specific URLs needing redirects, while a marketing manager will want to understand the context of crawl budget waste first.
I always include these key components in my reports:
- Executive Summary: A single paragraph stating the main problems and the top three things to do about them. For example: "Googlebot is wasting 40% of its crawl budget on filtered URLs; we recommend blocking these parameters immediately."
- Crawl Overview: A few high-level metrics to provide context. Think total Googlebot hits, the number of unique URLs crawled, and the overall distribution of status codes.
- Critical Issues Breakdown: This is the heart of the report. Detail the biggest problems you found, like widespread 404s, server errors, or nasty crawl traps. Most importantly, back every single claim with data from the logs.
- Identified Opportunities: Frame your findings positively. Instead of just listing problems, show the upside. For example: "Reclaiming this wasted crawl budget will help Google discover and index our new product lines much faster."
The most effective log file analysis reports don't just present data; they tell a story. The story is simple: "Here is how search engines are wasting resources on our site, and here is the straightforward plan to fix it and improve performance."
The Power of Simple Visualizations
Never, ever underestimate the power of a good chart. Raw numbers and long lists of URLs are abstract and hard for most people to grasp. Simple, clear visuals can turn complex data into an easy-to-understand story, driving home the severity of an issue in a single glance. You don't need fancy, intricate dashboards—a few well-chosen charts are way more effective.
For instance, a pie chart is perfect for showing the distribution of HTTP status codes. Seeing a giant red slice for "404 Not Found" is instantly more alarming than reading a number buried in a table.
A bar chart comparing the number of Googlebot hits by page type can also be a real eye-opener. It might starkly illustrate that your blog's tag pages are getting more crawl attention than your core product categories, which is a problem you can now prove.
These visuals make your findings undeniable and build a strong case for dedicating resources to the fixes. They bridge the gap between technical analysis and business impact, which is essential for getting that all-important sign-off. If you need more guidance on putting it all together, check out our detailed article on what is an SEO report. It provides a solid framework you can adapt for any kind of SEO reporting.
Still Have Questions About Log File Analysis?
Even with the best tools and a solid plan, getting your hands dirty with log files for the first time can feel a bit daunting. Let's walk through some of the questions that pop up most often so you can move forward with confidence and get real value from your analysis.
How Often Should I Be Doing This?
For most sites, running a log file analysis once a quarter is a great rhythm. It's frequent enough to spot crawling trends and new problems before they spiral out of control, but not so often that you're buried in data.
Of course, this isn't set in stone. The right frequency really depends on your specific situation:
- Massive sites (1M+ pages): You'll want to do this monthly. On a site that large, even small crawling inefficiencies can blow up into major crawl budget issues fast.
- After a site migration: Don't wait around. Get in there and analyze your logs within the first one to two weeks after the switch. This is your chance to confirm that search engines are finding your new URLs and following your redirects correctly.
-
Following a major technical change: If you've just overhauled your
robots.txtor squashed a persistent server error, run a quick analysis a couple of weeks later. It's the only way to be sure your fix actually worked as intended.
Think of log file analysis as a regular health check for your site's technical SEO. It's not a one-and-done task; it's an ongoing process to make sure everything is running smoothly behind the scenes.
Can I Trust a Bot That Says It's Googlebot?
The quick answer: absolutely not. At least, not on its own.
A bot identifies itself using a user-agent string, but that piece of text can be faked by anyone. A scraper, a competitor's tool, or any number of other bots could be hitting your site while pretending to be Googlebot. If you just trust the user-agent, your entire analysis could be based on bad data.
The only way to be certain is to run a reverse DNS lookup on the request's IP address. A real request from Google will always resolve to a domain ending in googlebot.com or google.com. The good news is you don't have to do this by hand for thousands of requests. Professional tools like the Screaming Frog Log File Analyser handle this verification for you automatically, cleanly separating the real search crawlers from the imposters.
What's the Single Biggest Mistake People Make?
Hands down, the most common mistake is looking at log files in a vacuum. Your logs tell you what search engines are crawling, but they give you zero information about what they're missing. Without that other half of the story, you're flying blind.
This is why you must merge your log data with a full website crawl from a tool like the Screaming Frog SEO Spider. It's this combined dataset that unlocks the most powerful insights. Suddenly, you can spot critical issues that were invisible before, like:
- Orphaned Pages: URLs that Google is hitting but have no internal links pointing to them. How are they even finding them?
- Uncrawled Important Pages: High-priority category or product pages that Googlebot, for whatever reason, has never even visited.
Combining these two data sources turns a simple activity log into a strategic roadmap for improving your site's crawlability.
Isn't This Just the Same Information I Get in Google Search Console?
Not at all. The two are perfect complements. Think of the Crawl Stats report in Google Search Console as a high-level executive summary. Your log files are the complete, unabridged novel.
GSC provides sampled and aggregated data, which is fantastic for spotting big-picture trends. But log files give you the raw, hit-by-hit data of every single request a crawler makes. That level of detail is essential for diagnosing the tricky, specific problems that GSC's summary view will almost always miss—things like intermittent 500 errors, weird redirect loops, or subtle crawl traps.
Ready to stop guessing and start knowing exactly how search engines see your website? The team at Restaurant Equipment SEO can turn your raw log files into a prioritized action plan that drives real results. Visit us today to learn how our specialized SEO services can help you dominate the food service industry.