
Analyzing Log Files: Master Crawl Budget and Boost SEO Performance
Analyzing log files means digging into the records your server automatically creates to see how search engine bots and real people interact with your website. For a restaurant equipment store, this data is pure gold. It’s where you find hidden technical SEO problems, see where your crawl budget is being wasted, and spot opportunities to get Google to index your most profitable pages.
Why Log File Analysis Is Your SEO Superpower

Let's be real—server logs aren't the most exciting part of SEO. They look cryptic, they're massive, and most people find them intimidating. But here's the secret: they offer a direct, unfiltered view of how search engines like Google actually see and crawl your site.
Think of it as a diary your server keeps, meticulously noting every single visit from Googlebot, every user request, and every error it runs into.
Uncovering the Truth in Your Data
For a restaurant equipment seller, this raw data is incredibly valuable. Your standard analytics tools tell you what users do once they arrive, but log files show you what the search engine crawlers are doing before a user ever has a chance to get there.
This is how you answer the tough questions that directly impact your sales and your ability to pull in more organic search traffic.
With this data, you can finally see if Google is wasting its limited crawl budget on things like:
- Old, filtered URLs from a previous version of your site.
- Chains of redirects that kill your link equity.
- Low-value pages instead of your brand-new, high-margin product lines.
Log file analysis takes you from guessing about technical problems to knowing exactly where they are. It’s the difference between treating symptoms and actually curing what’s hurting your website's performance.
A Practical and Strategic Approach
When you get comfortable with log files, you're embracing true data-driven decision-making. This guide is designed to cut through the technical noise and give you a practical, real-world workflow. I'll show you how to turn those cryptic lines of code into clear, actionable strategies that fix hidden issues and make every visit from Googlebot count.
The importance of this skill is growing fast. The log management market, which is all about analyzing these files, was valued at $2.51 billion and is expected to hit $5.52 billion by 2029. This boom is happening because as businesses generate huge amounts of data, they need better ways to make sense of it. If you want to dive deeper, you can check out the full research on log management to see the trends driving this growth.
Getting Your Hands on the Raw Data
Before you can start any real detective work, you’ve got to get the evidence. Your server's raw log files are the unfiltered truth about how search engines see your site, but getting them can sometimes feel like a bit of a treasure hunt. Where you find them and how you get them really depends on your hosting setup.
For most restaurant equipment sellers on platforms like GoDaddy or Bluehost, it's pretty simple. Just log into your control panel (usually cPanel or Plesk) and look for a section labeled "Raw Access Logs," "Logs," or something similar. You can typically download zipped .gz files for specific date ranges right from there.
Locating Your Log Files
If you don't have a control panel or you’re comfortable going a more direct route, you'll need to connect straight to your server. This usually means firing up an FTP (File Transfer Protocol) client like FileZilla or connecting through SSH (Secure Shell) if you have command-line access.
The exact path to your logs will vary based on your server software, but here are the usual suspects:
-
Apache Servers: Start by checking directories like
/var/log/apache2/or/var/log/httpd/. Sometimes they're tucked away in a user-specific path like/home/username/logs/. -
Nginx Servers: You'll almost always find these in
/var/log/nginx/. The two big ones areaccess.loganderror.log.
Keep in mind, these files can get massive—we're talking gigabytes of data per day for a busy e-commerce site. Downloading the whole thing is often out of the question. Your best bet is to grab a relevant chunk, like the last 7 to 30 days. That's usually enough to spot meaningful patterns without bringing your computer to its knees.
Pro Tip: If you have SSH access, don't download the whole file just to filter it later. Use command-line tools like
grepto pull out what you need before you download. For example, you can isolate every line containing "Googlebot" to drastically shrink the file size and get right to the good stuff.
Once you have your files, it's a good idea to follow some essential log management best practices to keep everything organized for ongoing analysis.
Making the Data Manageable
Okay, you’ve got the files. Now comes the most important part: cleaning them up. A raw log file is pure chaos—a stream of every single request to your server, from your homepage down to every last image, CSS file, and font. For a real SEO analysis, you have to cut through that noise.
The goal here is to isolate the requests that actually matter for SEO. That means filtering for a few key things:
-
Just the HTML Pages: You care about which of your pages are being crawled, not the supporting files. Filter out anything ending in
.css,.js,.jpg,.png, etc. - The Important Bots: You want to see what search engines are doing. Filter your data to only show user agents containing "Googlebot" and "Bingbot."
- Successful Hits (for now): Start by focusing on requests with a 200 OK status code. These are the successful page loads. You can (and should) circle back later to analyze the 4xx errors and 3xx redirects.
This filtering process is what turns a giant, messy dataset into a clean, actionable list of search engine activity. It's the foundation that makes the rest of your analysis faster and far more insightful.
To see how this raw server data fits into your broader marketing picture, check out our guide on setting up your analytics tracking ID and learn how different data sources work together.
Decoding a Typical Log File Entry
So, what are you actually looking at? At first glance, a log file entry looks like a cryptic line of text. But once you know what each part means, it tells a complete story.
Here’s a breakdown of the key components in a standard server log and what each one tells you about the visitor and their request.
| Field Name | Example Value | What It Tells You |
|---|---|---|
| IP Address | 66.249.66.1 |
The unique address of the client (e.g., Googlebot, a user's browser) making the request. |
| Timestamp | [10/Oct/2023:13:55:36 -0700] |
The exact date and time the server received the request, including the time zone offset. |
| Request Method | GET /products/commercial-refrigerator HTTP/1.1 |
How the server was asked for the resource (GET is most common), the page requested, and the protocol. |
| Status Code | 200 |
The server's response. 200 means success, 404 means not found, 301 means permanently moved. |
| Response Size | 15432 |
The size of the file sent back to the client, measured in bytes. |
| User-Agent | Mozilla/5.0 (compatible; Googlebot/2.1; +http://www.google.com/bot.html) |
The identifier of the client. This is how you spot Googlebot, Bingbot, or a specific web browser. |
Breaking down these entries is the first step in turning raw data into powerful SEO insights about crawl patterns, site errors, and bot behavior.
Choosing the Right Tools for the Job
Staring at a raw server log file feels like trying to read a phone book from the 90s. Sure, the information is all there, but it’s a dense, overwhelming wall of text that’s nearly impossible to make sense of at a glance.
To turn that raw data into actual, usable insights, you need a good toolkit. The great news is you have options, from incredibly user-friendly software to powerful command-line utilities. Your choice really comes down to your technical comfort level, your budget, and what you’re trying to find out. There's no single "best" tool, just the right tool for the job at hand.
SEO-Focused Log File Analyzers
For most folks in the restaurant equipment space, a dedicated SEO log analysis tool is the perfect place to start. These programs are built specifically to help you visualize how search engines crawl your site, and you don’t need a computer science degree to use them.
Two of the most popular options out there are:
- Screaming Frog SEO Log File Analyser: This is a desktop application that brilliantly connects the dots between your log data and your own site crawl data. You feed it your log files, and it automatically pinpoints which bots are visiting, verifies them, and shows you which URLs get crawled the most, which are ignored, and where errors are popping up. It's a beast for finding and fixing crawl budget waste.
- Semrush Log File Analyzer: As part of its broader Site Audit tool, Semrush offers a cloud-based solution. You upload your logs, and it combines that data with its own crawl findings to deliver a comprehensive report on bot activity, status codes, and overall crawl efficiency.
These visual tools turn abstract lines of text into clean charts and tables, making it dead simple to spot trends. The demand for these tools is huge for a reason; the global market for log analysis tools was valued at $2.5 billion and is expected to hit $6.3 billion by 2032. As you can discover more insights about this trend on Technavio.com, this growth shows just how vital this data has become.
Deciding on the right SEO software is often about how it fits into your larger strategy. If you're building out your toolkit, our guide on the best tools for competitor analysis can help you see how different platforms complement each other.
The Hands-On Command-Line Approach
If you're comfortable getting your hands a little dirty and want to avoid paying for more software, the command line is your best friend. With the built-in utilities on a Mac or a Linux server, you can slice and dice log data with surgical precision. It's fast, it's free, and it gives you total control.
For a quick, specific question—like "show me all the 404 errors Googlebot hit yesterday"—the command line is almost always faster than opening up a dedicated app. It’s a core skill for anyone who's serious about technical SEO.
The two commands you'll lean on most are grep and awk.
-
grepis your go-to for filtering. You can use it to instantly pull every line containing "Googlebot" or every single request that resulted in a "404" status code. -
awkis a powerful pattern-scanning tool for processing structured text. It’s perfect for more complex tasks, like counting how many times each unique URL was crawled or calculating the total bandwidth Bingbot consumed.
This diagram gives you a simple look at the workflow for getting your log data ready for analysis.
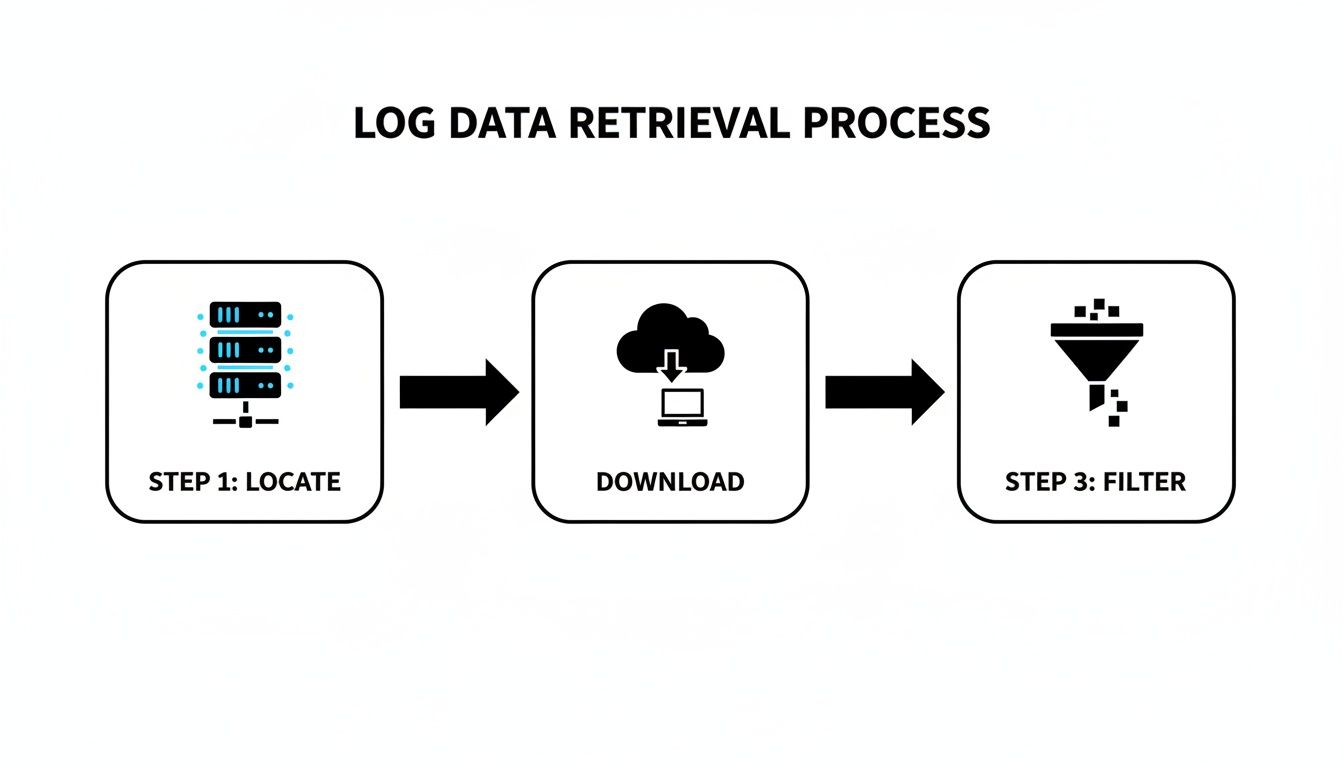
This process—finding, downloading, and filtering your data—is the foundational work you have to do before any tool can give you meaningful answers.
When to Scale Up to Enterprise Solutions
For massive, high-traffic e-commerce sites, analyzing log files can quickly become a big data problem. When you're dealing with hundreds of gigabytes of logs every day, desktop tools and simple scripts just aren't going to cut it. That's when you need to look at enterprise-grade solutions.
The most famous of these is the ELK Stack (Elasticsearch, Logstash, and Kibana). This is a heavy-duty, open-source trio that works together to:
- Collect logs from all your servers (Logstash)
- Store and search them in a hyper-efficient database (Elasticsearch)
- Create real-time dashboards and visualizations (Kibana)
Setting up an ELK Stack takes serious technical know-how, but it gives you a scalable, central hub for monitoring site health, security, and SEO performance in near real-time. It’s definitely overkill for most businesses, but for large-scale operations, it's essential.
Turning Log Data into Actionable SEO Fixes

Alright, you've gathered the logs and have your tools ready. This is where the real detective work starts—transforming those cryptic lines of server requests into a high-priority SEO to-do list. Your log files are the raw, unfiltered truth of how search engines see your site, letting you spot problems that standard crawlers completely miss.
The name of the game is pattern recognition. You’re not just looking at single log entries. You’re hunting for recurring behaviors that point to deeper, systemic issues. It's all about finding where Googlebot is getting stuck, what it can't find, and where its time is being completely wasted.
Pinpointing Critical Crawl Budget Waste
Every site has a finite crawl budget, which is just the amount of time and resources Google is willing to spend crawling your pages. For a large restaurant equipment store with thousands of SKUs, that budget is precious. If Googlebot is wasting its time on junk pages, your most important product and category pages might not get crawled often enough—or at all.
Log files are the only place to get the hard data on this. By filtering your logs to show only Googlebot's activity, you can see exactly which URLs it’s hitting over and over again.
Keep an eye out for high crawl counts on URLs that have zero SEO value. I typically find the biggest offenders are:
-
Parameterized URLs: Faceted navigation is a UX lifesaver but an SEO nightmare, creating thousands of duplicate URLs (like
?color=stainless-steel&brand=true). Googlebot crawling these is a massive waste of its time. - Old Promotional Pages: That landing page for a 2019 Black Friday sale that’s still live? I guarantee you it’s getting crawled.
- Internal Search Results: If your site's internal search pages are indexable, Googlebot can get trapped in a black hole, crawling an endless pit of thin, low-quality pages.
Once you spot these patterns, the fix is direct. Use your robots.txt file to block crawling on these sections, add nofollow tags to the internal links pointing to them, or configure the URL Parameters tool in Google Search Console to tell Google how to handle specific parameters.
Uncovering Hidden 404 Errors
Tools like Screaming Frog are fantastic for finding broken internal links. What they can’t tell you about are the broken external links from other websites pointing to pages that no longer exist on your site. Log files can.
Filter your logs for any Googlebot request that returned a 404 (Not Found) status code. This gives you a list of every single time Google followed a link—internal or external—to a dead end.
When you're digging into 404s, frequency is key. A single hit could be a fluke. But a URL that gets a 404 from Googlebot dozens of times a day points to a significant broken backlink that’s leaking valuable authority.
Let’s say you find Googlebot repeatedly trying to access /products/old-ice-machine-model.pdf. A standard site audit won't catch this. But your logs reveal an authoritative industry blog is still linking to that old PDF manual. Now you have a clear action item: set up a 301 redirect from the old PDF URL to the current product page for that ice machine. Instantly, you reclaim that link equity and provide a much better user experience.
Diagnosing Problematic Redirect Chains
Redirects are a normal part of running a website, but they become a real drag on performance when they’re chained together. A redirect from Page A to Page B, which then redirects to Page C, forces Googlebot to make extra requests. This slows down crawling and can dilute the authority being passed.
Logs make these chains painfully obvious. As you trace Googlebot’s path, you might see a sequence like this:
-
GET /commercial-grills->301 Moved Permanently -
GET /commercial-grills-and-griddles->301 Moved Permanently -
GET /restaurant-grills->200 OK
This is a classic redirect chain. The fix is simple: update the original links (and any internal ones you control) to point directly to the final destination, /restaurant-grills. This cleans up the crawl path and ensures the final URL gets the maximum authority.
Building Your Priority Action List
The final piece of the puzzle is turning your findings into a structured plan. Don't just make a random list of issues; prioritize them based on their potential SEO impact.
I like to organize my action plan into a simple table to keep things clear.
| Priority | Issue Discovered in Logs | Action Required | Impact Score |
|---|---|---|---|
| High | Googlebot hits thousands of parameterized filter URLs daily | Disallow ?brand= parameter in robots.txt and GSC. |
9/10 |
| High | A high-authority backlink points to a 404 page. | Implement a 301 redirect to the most relevant live page. | 8/10 |
| Medium | Redirect chain identified on a key category page. | Update all internal links to point to the final destination URL. | 6/10 |
| Low | Bingbot is crawling old PDF spec sheets. | Add PDF directory to robots.txt if they hold no value. |
3/10 |
This kind of structured approach transforms a complex technical audit into a clear, manageable project. By systematically finding and fixing these hidden problems, you ensure search engines can efficiently find, understand, and rank the pages that actually make you money.
Gaining a Strategic Edge with Advanced Analysis

Once you've handled the immediate fixes like 404s and redirects, you can start using log files for something much more powerful. This is where you shift from just patching holes to actively guiding your entire SEO strategy based on how Googlebot actually behaves on your site. The goal is simple: see your site through Google's eyes and make decisions based on what it prioritizes.
Looking at crawl frequency is the first step. This raw data shows you exactly where crawlers are spending their limited time and resources. Is Googlebot obsessed with your blog, your main product categories, or a few specific high-margin commercial oven pages? The logs hold the answer.
Discovering What Google Truly Cares About
When you map crawl frequency against your site architecture, you get a crystal-clear picture of what Google thinks is important. Let's say you see Googlebot hitting your /commercial-refrigerators/ category page 50 times a day, but it only crawls your newer /ice-machines/ section once a week. You've just stumbled upon a massive insight. This tells you your internal linking is likely signaling that refrigerators are far more important.
With this knowledge, you can take precise, targeted action:
-
Beef Up Internal Linking: Go back to your high-authority blog posts and other popular categories and add more relevant internal links pointing directly to the under-crawled
/ice-machines/section. - Rethink Your Content Calendar: Prioritize creating new, in-depth content—like buying guides or comparison articles—that naturally links back to the ice machine category, reinforcing its importance.
-
Check Your Sitemap: Make sure the priority settings in your
sitemap.xmlfile accurately reflect the pages you want Google to focus on.
This approach turns your log data from a boring text file into a practical guide for shaping how search engines perceive your site's structure and value.
Analyzing the Behavior of Different Bots
Not all search engine bots are created equal, and they certainly don't behave the same way. A smart move is to segment your log data by user-agent to compare the crawl patterns of bots from Google, Bing, and others. You might find that they prioritize completely different areas of your website.
For instance, you might see that Bingbot spends an unusual amount of time crawling old PDF spec sheets while Googlebot completely ignores them. This could inform a decision to use robots.txt to block Bingbot from those directories, saving server resources without touching your primary search engine traffic.
The real gold is in comparing mobile versus desktop bot behavior. Look for any differences. Is Googlebot-Mobile hitting a different set of pages than Googlebot-Desktop? This could point to serious issues with your mobile navigation or internal linking that you'd never spot from your desktop.
Using Data to Build a Proactive Technical Roadmap
Ultimately, these advanced insights should feed directly into your long-term planning. The patterns you find in your logs provide the "why" behind your technical SEO initiatives. Instead of just saying, "we need to improve our internal linking," you can present a data-backed case: "Log analysis shows Googlebot under-crawls our highest-margin product categories, so we're implementing a new linking module to boost their crawl frequency."
This makes your SEO efforts far more precise and much easier to justify to stakeholders. It also helps you get ahead of problems before they ever impact your rankings.
The power of this analytical approach isn't just for SEO. In the cybersecurity world, tools from market leaders like Splunk—which holds 47.51% of the security analytics market—use powerful query languages to dissect logs for threat patterns. This can lead to 90% faster root cause analysis, and studies show real-time monitoring can detect 78% of breaches within hours. You can learn more about the log management market on grandviewresearch.com. By adopting a similar mindset for SEO, you can uncover performance issues with the same level of precision.
Your Log Analysis Questions, Answered
Jumping into server logs for the first time feels a bit like popping the hood on a car when you're used to just looking at the dashboard. It’s a whole different view compared to the polished reports in your usual analytics tools. Let's clear up some of the most common questions people have when they start this journey.
My goal here is to pull back the curtain on the process, turning log analysis from an intimidating chore into a powerful part of your SEO strategy.
How Often Should I Actually Do This?
Honestly, there’s no single right answer—it all comes down to your site and your goals. If you're running a big e-commerce store like a restaurant equipment supplier with inventory changing daily and frequent site updates, you’ll want to be in there weekly or bi-weekly. This cadence helps you spot new crawl problems before they can do any real damage to your rankings.
On the other hand, if your site is more static—maybe a brochure site that you don't update often—a monthly check-in is probably plenty. The most important thing is to be consistent.
Pro Tip: Set a recurring reminder in your calendar. Whether it's the first Monday of every month or a quick check every Friday afternoon, making it a routine ensures it gets done. This habit is what helps you spot trends and catch issues before they escalate.
There are exceptions, of course. After a major event like a site migration or launching a whole new category of products, you need to be much more vigilant. I'd recommend checking your logs daily for at least the first week to make sure search engines are finding the new pages and not just running into a wall of 404 errors or endless redirect loops.
Will Digging Into Logs Slow Down My Website?
This is a great question, and I hear it all the time. The short answer is a definitive no.
Log file analysis is a completely passive, "read-only" activity. You're simply looking at a historical record of events that have already happened on your server.
Think of it this way:
- First, you download a copy of the log files.
- Then, you analyze that copy on your own machine or using a separate tool.
Nothing in that process puts any extra strain on your live server. It has zero impact on the experience of your customers or the search bots crawling your site at that moment. It's like reading the captain's log after the ship is already back in the harbor—you’re just reviewing the journey, not rocking the boat.
Can I Just Ditch Google Analytics and Use Logs Instead?
Tempting, but no. Log files and analytics platforms like Google Analytics are two different tools for two very different jobs. One really can't replace the other; they complement each other perfectly.
Here’s how I explain the difference to my clients:
| Data Source | What It Shows You | The Big Question It Answers |
|---|---|---|
| Log Files | How search engine bots see and interact with your server. | "Is Googlebot crawling my most important pages efficiently?" |
| Analytics Tools | How human visitors behave on your website. | "What do people do after they land on my commercial oven page?" |
Logs give you the unfiltered, technical truth about how easily search engines can access your content. Analytics gives you the story of what human users do once they get there. You need logs to make sure your pages get found and indexed, and you need analytics to optimize those pages for the people who visit them. Using both gives you the full picture of your site's health and performance.
At Restaurant Equipment SEO, we translate complex data like server logs into straightforward, actionable plans that help your business grow. If you're ready to find hidden opportunities and fix the technical snags holding you back, let's talk. See how our specialized SEO services for restaurant equipment sellers can get you the visibility you deserve.