
Site Conversion Optimization: Master site conversion optimization for B2B equipment sellers
You’ve done the hard work of getting people to your restaurant equipment website. The traffic numbers are up, but the quote requests and sales are... flat. It's a frustratingly common scenario, but it’s far from a dead end.
Getting visitors is only the first part of the equation. The real trick is turning that traffic into revenue. This is where site conversion optimization (CRO) comes in. It’s not about just getting more clicks; it’s about making every click count.
Turn High Traffic Into High Revenue With CRO
Think of CRO as the bridge between attracting an audience and actually growing your business. It's a systematic, data-backed process for understanding what your visitors are trying to do and then removing any roadblocks that get in their way.
When you focus on CRO, you’re making your marketing spend work harder and smarter. Instead of constantly pouring money into getting new eyeballs on the site, you’re making sure the visitors you already have are more likely to become customers.
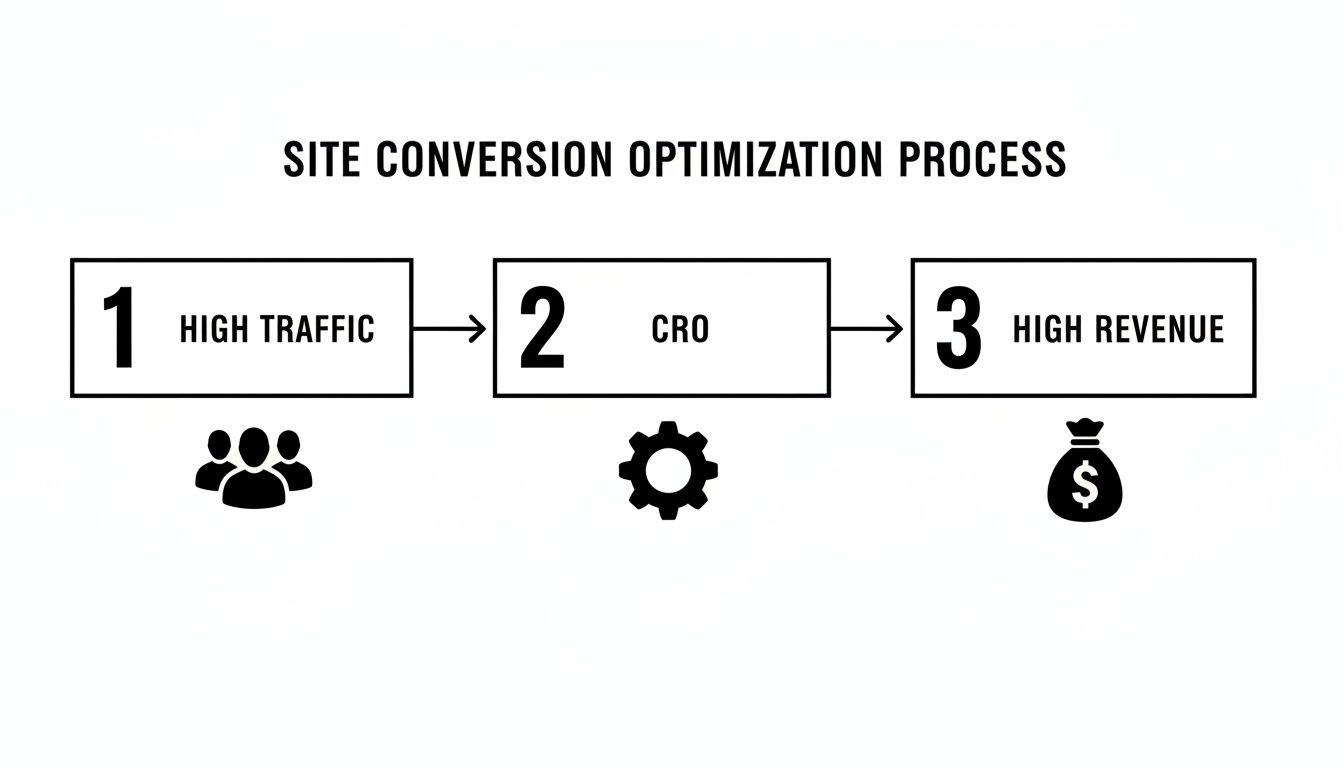
This is how you stop spinning your wheels and start building a real sales engine.
Understanding the Conversion Landscape
Too many businesses fall into the trap of thinking that more traffic will automatically solve their sales problems. But if your website is confusing or difficult to use, you're just sending more people down a dead-end street. Small, strategic changes—based on real user data, not just gut feelings—can lead to huge improvements.
Let's look at the numbers. The average website conversion rate across all industries is a pretty modest 2.3%. That means for every 100 people who visit, only about two will actually take the action you want them to.
But here’s the good news: the top-performing sites, those in the 90th percentile, see conversion rates of 11% or higher. That's the difference between struggling and thriving. For B2B businesses like yours, lead generation rates can range anywhere from 1.7% to 10.8%, which just goes to show how much room there is for improvement when you get things right.
The core idea of CRO isn't about tricking people into buying. It’s about making it incredibly easy for them to do what they already want to do. By getting rid of the friction—whether it's a slow page, a confusing form, or a hidden "Add to Cart" button—you create a better experience that naturally leads to more conversions.
To get started, you need to diagnose what's holding your site back. This playbook will show you exactly how to do that. You can also dig deeper into how to improve website conversion rates to build on these fundamentals. Let's get started.
Laying the Groundwork: Analytics and Goal Setting
Before you even think about changing a button color or A/B testing a headline, you have to get your data straight. I’ve seen too many businesses jump into making changes based on gut feelings, and it almost never works. Real, effective conversion optimization starts with a clear, accurate picture of what’s happening on your site right now. Anything else is just a shot in the dark.
Think of your website like a physical showroom. You’d want to know who walks in, which aisles they browse, what equipment they linger on, and where they seem to get frustrated and walk out. That's exactly what a solid analytics setup, specifically with Google Analytics 4 (GA4), does for your online store.
Go Beyond "Vanity Metrics"
For years, people obsessed over metrics like page views and how long someone spent on a page. The truth is, those numbers don't tell you much about your business's health. Someone could spend ten minutes on your walk-in freezer page because they're genuinely interested, or they could be hopelessly lost and confused. The metric doesn't tell you which it is.
We need to focus on tracking actions that actually lead to revenue. These are your conversion goals, and for a restaurant equipment dealer, they're much more specific than a simple "purchase" event.
You should be tracking tangible business events like these:
- 'generate_lead': A user submits a "Request a Quote" form for a specific combi oven.
- 'add_to_cart': A chef adds a six-burner commercial range to their cart.
- 'view_item': Someone views a high-value product page, like a new line of ice machines.
- 'download_spec_sheet': A potential buyer downloads a PDF with technical specs for an undercounter refrigerator.
- 'watch_demo_video': Capturing views on videos showing a piece of equipment in action.
Each of these is a critical step in a complex buying journey. By tracking them as events in GA4, you start to see exactly where your users are engaging and, more importantly, where they’re giving up. If you need a deeper dive, here's a guide to setting up proper analytics tracking for your website and why it’s so foundational.
Map the Funnel and Find the Leaks
With your key events firing correctly, you can finally map out what your sales funnel actually looks like. A common one I see on equipment sites is: a visitor lands on a category page for "Commercial Fryers," clicks a specific product, views the spec sheet, and then clicks "Add to Quote."
This GA4 dashboard shows a high-level overview of user engagement and event counts.
Now, the magic happens when you analyze the flow between these steps. The data might show that 70% of users who view a product page never click the quote button. That’s not just a statistic; it's a massive red flag pointing to a huge friction point.
This immediately tells you there's something wrong with your product pages. Is the quote button buried? Is pricing unclear? Is the shipping information missing? The data won't give you the why, but it tells you exactly where to start looking for answers.
You cannot optimize what you do not measure. Setting up clear, business-relevant goals in your analytics transforms it from a confusing dashboard into a powerful diagnostic tool for your business.
This data-first approach is what separates guessing from growing. It lets you focus your time and money where they’ll have the biggest impact. By understanding the path your customers take—and where they stumble—you can start forming smart hypotheses for improvement. That's the next step in turning more of those hard-earned visitors into actual customers.
Uncover Friction Points Using Data and User Feedback
Now that you have your analytics set up, you have a map of what's happening on your site. You can see the traffic flow, which pages are popular, and exactly where you’re losing people. This quantitative data is the bedrock of any serious site conversion optimization program, but it only tells you half the story.
The other half is the why. Why are potential customers abandoning a quote request halfway through? What’s making them pause on a product page and then just leave?
This is where you put on your detective hat. The goal is to combine the hard numbers with real human insights to find those "friction points"—the annoying, confusing, or frustrating spots on your website that stop a user dead in their tracks. These are the conversion killers silently costing you business.

Seeing Your Site Through Your Customers' Eyes
The most powerful way to understand what’s going wrong is to literally watch people use your site. Tools that provide heatmaps and session recordings are worth their weight in gold here. They take you out of the abstract world of data tables and let you see your website through a visitor's eyes.
- Heatmaps give you an aggregated picture of where users are clicking, how they move their mouse, and how far they bother to scroll. You might discover that dozens of people are clicking on a static image, expecting it to be a link to more information.
- Session Recordings are like having a camera over your user's shoulder. Watching these can be an eye-opening (and sometimes painful) experience. You'll see users rage-click a broken button, hesitate over a confusing form field, or scroll up and down a page trying to find shipping details for a 500-pound ice machine.
For instance, a heatmap on your commercial refrigerators category page might show that nobody is using the "Filter by Voltage" option you thought was so important. Or a session recording could reveal a user trying to add an item to their quote, only to get stuck because the button is unresponsive on their phone.
Combining Quantitative and Qualitative Insights
The real magic happens when you pair these two types of data. Your analytics tell you that a product page has a shockingly high exit rate, but a session recording shows you why—visitors can't find the downloadable spec sheet.
Think about where you stand. While global e-commerce averages float around 2-4%, the B2B food service equipment space sees conversion rates of 2.7% from organic search and up to 3.3% overall. High-intent direct traffic converts at a solid 3.2%. But here's the kicker: mobile traffic, which makes up a massive 73% of all visits, converts at a lower 2.9%, and mobile cart abandonment is a staggering 77.2%.
If your mobile abandonment rate is sky-high, you know you have a friction problem in your mobile checkout. You can learn more about these industry conversion rate averages on roastmyweb.com.
The best optimization insights live at the intersection of what users do (analytics) and why they do it (feedback). One without the other is an incomplete picture.
Gathering Direct User Feedback
Sometimes, the simplest path to an answer is to just ask. You don’t need to launch a massive, 20-question survey. Small, in-the-moment feedback tools can deliver a goldmine of actionable information.
Here are a few practical ways to do it:
- On-Page Surveys: Put a small pop-up on the quote confirmation page that asks, "What was the one thing that almost stopped you from requesting a quote today?" This can uncover hidden objections you never would have guessed.
- Exit-Intent Polls: As a user is about to leave a product page, a quick poll can ask, "Did you find the information you were looking for?" with a simple "Yes/No" and a comment box. The "No" responses are pure gold.
- Analyze Support Chats: Your sales and customer service teams are on the front lines every single day. Talk to them. If they’re getting ten calls a week asking about warranty information, that’s your cue that the info isn’t clear enough on the site.
By blending these quantitative and qualitative methods, you stop guessing and start building a data-driven strategy. Each piece of feedback and every behavioral insight gives you another potential fix to add to your list, setting you up perfectly for the next step: prioritizing what to test first. To get a handle on all the underlying issues, it helps to understand how to perform a comprehensive website audit.
Prioritize and Test Your Optimization Ideas

Alright, you've dug through the analytics and sifted through customer feedback. Now you’re probably looking at a massive list of potential website fixes, from tiny tweaks to major overhauls. The big question is: where on earth do you begin?
If you try to tackle everything at once, you'll burn out. But if you gamble on a huge redesign without any real data to back it up, you're just throwing resources into the wind.
The secret to effective site conversion optimization is moving from a scattered list of problems to a prioritized roadmap of testable ideas. This is how you stop wasting time on changes that don't actually move the needle and focus on what truly matters to your bottom line.
This structured process is the difference between guessing what works and knowing what works. It helps you decide whether to simply change your form's call-to-action from "Submit" to "Get My Free Quote" or to redesign an entire product page from scratch.
A Simple Framework for Prioritization
Let's be honest, not all optimization ideas are created equal. A simple framework like the PIE model is a fantastic way to logically score and rank your ideas, so you can focus your team’s energy where it will have the biggest impact.
PIE is an acronym that stands for:
- Potential: How much room for improvement is there on the page you're looking at? A high-traffic product page with a dismal conversion rate has far more potential than a low-traffic "About Us" page.
- Importance: How valuable is the traffic to this specific page? Improving the checkout funnel is always going to be more important than tweaking a blog post because it's directly tied to revenue.
- Ease: How quickly and easily can you get this test up and running? Changing a headline is a low-effort task. A complete navigation redesign? That’s going to require a lot more developer and design time.
Just score each idea on a scale from 1 to 10 for each category, then add up the scores. The ideas with the highest totals are your top priorities. It’s a straightforward, data-informed way to pick your battles.
From Vague Idea to Testable Hypothesis
An idea like "make the product page better" is useless because you can't test it. A strong hypothesis, on the other hand, is a clear statement that you can actually prove or disprove with an A/B test.
It should always follow this basic structure: "If we [make this specific change], then [this specific metric] will improve because [this is the reason why]."
Here's a real-world example:
If we replace the generic 'Submit' button on our quote form with 'Get Instant Quote,' then form submissions will increase because the new text creates a stronger sense of urgency and immediate value for the user.
See how specific that is? It clearly defines the change, the metric you'll be watching, and the user psychology you're trying to influence.
Running A/B Tests That Actually Work
Once you have a prioritized hypothesis, it's time to put it to the test. A/B testing (or split testing) is all about showing two different versions of a page to your visitors to see which one performs better.
To get reliable results, keep these rules in mind:
- Test One Thing at a Time. If you change the headline, button color, and the main image all at once, you’ll never know which change actually made the difference. Isolate your variables.
- Make Sure It's Statistically Significant. Don't call a test after just a couple of days because one version seems to be winning. You need enough data to be confident the result isn't just random chance. Most testing platforms like VWO or Optimizely have built-in significance calculators.
- Run It Long Enough. Let your test run for at least a full business cycle—typically one or two weeks. This helps smooth out any weird traffic fluctuations that happen on different days of the week.
A/B Testing Hypothesis Prioritization Framework (PIE Model)
Use this model to score and prioritize potential A/B tests for your restaurant equipment website based on their potential impact, importance to your goals, and ease of implementation.
| Hypothesis Idea | Potential (1-10) | Importance (1-10) | Ease (1-10) | Total Score |
|---|---|---|---|---|
| Change product page CTA to 'Add to Quote' from 'Add to Cart' | 8 | 9 | 9 | 26 |
| Add a video demo to top-selling ice machine pages | 7 | 8 | 4 | 19 |
| Simplify the checkout form from 12 fields to 7 | 9 | 10 | 2 | 21 |
| Change category page headline to be more benefit-driven | 5 | 6 | 8 | 19 |
| Redesign the entire homepage layout | 10 | 7 | 1 | 18 |
After scoring your ideas, you can quickly see which ones offer the best combination of impact and feasibility to tackle first.
The payoff for building a consistent testing culture is huge. Companies that regularly run CRO experiments often see 1.8 times higher annual revenue. Simple changes, like reducing clutter above the fold, can boost engagement by 16%, while consistent branding across your site can lift conversions by 10%. Even basic A/B tests on button colors have been shown to produce an average 6% lift. You can dig into more stats about the impact of consistent CRO on marketingltb.com.
This methodical approach—prioritize, hypothesize, test, repeat—is the engine that drives real growth. It turns your website from a static online catalog into a dynamic sales tool that gets smarter and more effective over time.
Roll Out High-Impact Changes on Your Key Pages
Once you’ve run your A/B tests, you'll have data-backed winners. This is the fun part. You get to move from experimenting to implementing, rolling out these proven improvements to the most important pages on your website.
The idea isn't to just tinker around the edges. We're talking about making high-impact optimizations that directly fix the friction points you've already found. These are the changes that smooth out the customer's journey from just browsing to actually buying, making it dead simple for them to get what they need and hit that "Request a Quote" button.
Fine-Tuning Your Product Pages
Your product pages are your digital showroom. This is where a busy chef or a restaurant owner makes the call on whether your commercial oven or walk-in cooler is the right piece of kit for their kitchen. Every single element needs to build confidence and push them toward taking action.
For restaurant equipment, visuals are everything. You absolutely need multiple high-resolution images showing the product from every conceivable angle. Get close-ups of the controls, shots of the interior, and even the back where the connections are. Even better? A short video showing the equipment in action can be a game-changer.
Next, take a hard look at your product descriptions. Are they just a list of specs, or do they speak to the customer's real-world problems? Instead of "High-output ice machine," try something like, "Pumps out up to 500 lbs of ice daily, easily serving 200+ customers on your busiest nights." See the difference? You’re connecting the feature directly to their business needs.
And please, make the spec sheets easy to find. A big, obvious button to download the PDF is all you need. Hiding this information or making people hunt for it is a classic conversion killer.
Enhancing Category Pages for Easy Navigation
Think of your category pages as the main aisles of your store. They're often the first stop for a buyer who knows they need a fryer but hasn't settled on a specific model yet. The main job of these pages is to help them narrow down their options quickly. A cluttered, confusing page just sends them packing.
The single most powerful thing you can do here is to beef up your filtering and sorting options. Buyers need to be able to slice and dice your inventory by what actually matters to them.
- Brand: Let them pick the trusted brands they already know and love.
- Capacity: Allow filtering by output, size, or serving capacity.
- Price: A simple price slider is a must-have for buyers with a budget.
- Dimensions: This is non-negotiable for kitchens where every inch counts.
Making the search process a breeze is a cornerstone of a great user experience. If you want to dive deeper into this, check out our guide on user experience optimization.
A great category page acts like a helpful salesperson, guiding the customer directly to the most relevant options without overwhelming them. The easier you make the search, the more likely they are to proceed.
The payoff for these tweaks can be huge. While the average landing page converts at around 4.4%, we've seen high-intent equipment pages hit 9-12%. Simply optimizing your site for mobile can lead to 26% higher conversions, and cutting a form from seven fields down to three can give you a 20-35% lift. For more ideas, these 10 proven e-commerce conversion rate optimization tips are a great starting point.
Streamlining Your Checkout and Quote Forms
You’ve gotten them all the way to the finish line—the quote request or checkout form. This is where so many sales fall apart. It's the moment of highest commitment, and any friction here is deadly for your conversion rate. Your goal should be absolute, ruthless simplicity.
The most effective fix? Chop down the number of form fields. Be honest with yourself: do you really need their fax number right now? Only ask for the bare minimum you need to get them an accurate quote. Every field you remove makes the whole process feel faster and less of a chore.
Next, pile on the trust signals right where they're needed most. Place security badges and trust seals (like your SSL certificate) prominently near the submission button. You need to constantly reassure users that their information is safe with you.
Finally, just make it simple. Use a single, clear call-to-action button that says something like "Get My Free Quote" instead of a vague "Submit." And make sure the form is a dream to use on a phone—large fields, easy-to-tap buttons, and no weird zooming required. It's these page-level fixes that turn a decent website into a lead-generating machine.
Keep the Momentum Going with Continuous Improvement
It’s easy to get excited about a big A/B test win, but real site conversion optimization isn't about isolated victories. It’s about building a system—a growth engine—that constantly uncovers and solves problems. We're moving away from one-off projects and building a true culture of ongoing improvement.
Your job isn't done when a winning variation goes live. The real measure of success is the long-term impact on your business. Think sustained improvements in lead quality, higher average order values, and most importantly, a measurable lift in revenue. This is how your website transforms from a static digital catalog into a dynamic sales machine that gets smarter with every test.
Build Your Idea Backlog
To keep that engine running, you need fuel. That's where an "idea backlog" comes in. This is simply a living document—a spreadsheet, a Trello board, whatever works for you—where you capture every single optimization idea.
These ideas can come from anywhere: a frustrated customer's email, a pattern you spotted in Hotjar recordings, or a comment from a sales rep about a common question they get. No idea is too small. Documenting everything ensures you always have a prioritized queue of hypotheses ready to go, so you never lose momentum.
The Never-Ending Cycle of Optimization
The CRO process isn't linear; it's a loop. It's a structured cycle that moves from digging into the data to validating your ideas and then starting all over again, making sure every change is a calculated move.
Here's what that journey looks like in practice:
- Dig into the Data: Start with the numbers. Use analytics, heatmaps, and session recordings to see what users are doing on your site.
- Find the "Why": Data tells you what, but qualitative feedback tells you why. Use surveys and customer interviews to understand the motivations and frustrations behind their actions.
- Form a Hypothesis: Connect the dots. Turn your insights into a specific, testable statement like, "We believe that adding a 'Quick Ship' badge to in-stock items will increase add-to-carts by 10% because it addresses our customers' urgent replacement needs."
- Prioritize and Test: You'll have more ideas than you can test. Use a prioritization framework (like PIE or ICE) to rank them and then run clean, disciplined A/B tests.
- Analyze and Roll Out: Once you have a statistically significant winner, implement it. But don't stop there—monitor its long-term impact on key business metrics.
- Learn and Repeat: Every test, win or lose, teaches you something. Feed those learnings right back into the top of the funnel to spark new ideas for the next round.
CRO isn’t a project you finish; it’s a mindset of constant curiosity. When you bake this process into your team’s DNA, you create a powerful feedback loop where every experiment, successful or not, fuels the next wave of growth.
This is the shift from just optimizing pages to truly optimizing the business. It guarantees your website evolves right alongside your customers, delivering a better experience and driving more revenue, month after month.
CRO Questions We Hear All the Time
Diving into conversion optimization often sparks a few questions. Let's tackle some of the most common ones we get from equipment sellers so you can get started with clarity.
Do I Even Have Enough Traffic for A/B Testing?
This is a big one. While there's no single magic number, you need enough volume to trust your results. A good rule of thumb for a basic A/B test on a critical page is to aim for at least 1,000 unique visitors and, crucially, 100 conversions for each version you're testing.
If you're not there yet, don't worry. Just shift your focus to qualitative insights for now. Things like session recordings, heatmaps, and customer surveys will give you plenty of powerful data to work with.
What’s the Biggest CRO Mistake People Make?
Hands down, it's testing without a solid, data-backed hypothesis. I see it all the time—people randomly changing button colors or tweaking headlines because they saw someone else do it. That’s just guessing, and it wastes valuable time and traffic.
Every single test should start with an "if/then/because" statement. For example: "If we add trust seals to the checkout page, then we expect more users to complete their purchase, because it will address their security concerns." That's how you get real, actionable insights.
Don't get distracted by what's trendy. A great CRO strategy is about deeply understanding your customers and fixing their problems, not just blindly copying tactics from another industry.
How Can I Actually Measure the ROI from All This?
You need to connect your optimization efforts directly to your bottom line. It's simpler than it sounds.
Let's say a winning test increases your "Request a Quote" form submissions by 15%. If you know the average sale from one of those quotes is $2,000, you can calculate the direct lift in revenue. This is how you prove that CRO isn't just another marketing expense—it’s a profit engine.
Remember, the gains you make will build on each other. Industry benchmarks from sources like RoastMyWeb show that the top 20% of e-commerce sites convert at 3.5-5% or even higher. The secret? They're persistent. Even with some inconclusive results, companies running 10 or more experiments a month tend to grow 2.1x faster than those who don't.
Ready to turn your website traffic into measurable revenue? At Restaurant Equipment SEO, we specialize in building data-driven optimization strategies that generate high-quality leads for equipment sellers. Get your free consultation today!